Agonists: Constructing Dose-Response Curves
Summarising The Graphs
Click on the graphs for further information then turn to the next page.
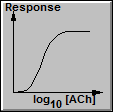
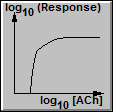
Most Useful Curve - Sigmoidal Curve
The sigmoidal curve forms the dose-response curve.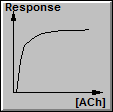
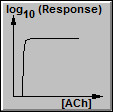
Of Some Use - Rectangular Hyperbola
You can find an estimate of Maximum Response from the rectangular hyperbola.
|
|
|
|
|
|
|
|
|
|
|
Graphs
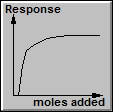
Of Little Use
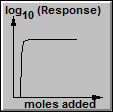
Of Little Use