Agonists: Constructing Dose-Response Curves
Summary
In this activity you have seen the following:
The Procedure For Constructing Dose-Response Curves
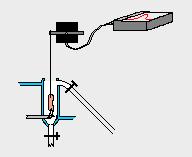
Find the response of the tissue to a range of concentrations of the drug.
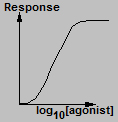
Plot the results on a dose-response curve.

How to Plot a Dose-Response Curve
You use the following axes:
y-axis = Response
x-axis = log10 Concentration of Drug
