Introduction To Pharmacokinetics
The Trapezoidal Rule
TRAPEZOIDS AND CURVES
Now consider a concentration-time graph. The following example shows the data and corresponding linear axes graph for the concentration against time for a single dose of drug given orally.
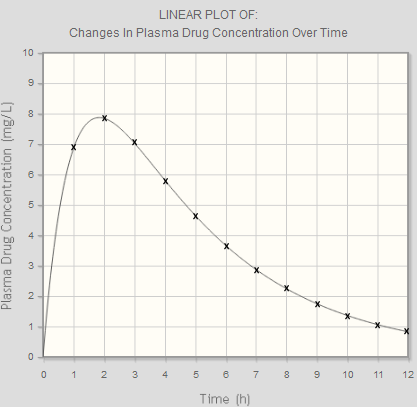
| Time (h) | Plasma Conc (mg/L) |
|---|---|
| 0 | 0 |
| 1 | 6.9 |
| 2 | 7.9 |
| 3 | 7.1 |
| 4 | 5.8 |
| 5 | 4.7 |
| 6 | 3.7 |
| Time (h) | Plasma Conc (mg/L) |
|---|---|
| 7 | 2.9 |
| 8 | 2.2 |
| 9 | 1.8 |
| 10 | 1.3 |
| 11 | 1.0 |
| 12 | 0.9 |
Looking at the graph, you can divide it into individual trapezoids (show me this).
You can then calculate the area for each trapezoid where:
- The length of the sides are the two plasma concentration readings
- The perpendicular height is the length of time between the two readings