Introduction To Pharmacokinetics
Plotting On A Semilogarithmic Graph
INTRODUCTION
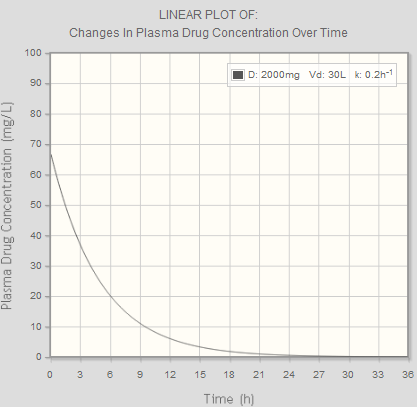
In pharmacology, you often need to know how the concentration of a drug changes over time.If you collect the data and plot the results on a graph showing concentration against time, for most drugs in the therapeutic range, you will obtain an exponential curve (see below left).
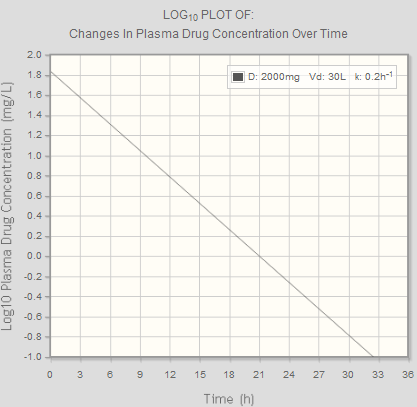
If instead of plotting concentration against time you plot log10 concentration against time, you obtain a linear graph (see below right). This linear graph is very useful and can be used to find the value of several pharmacokinetic parameters including half-life and elimination rate constant.