Introduction To Pharmacokinetics
Plotting On A Semilogarithmic Graph
INTRODUCTION CONTINUED
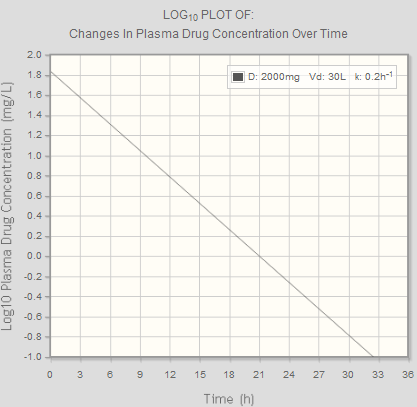
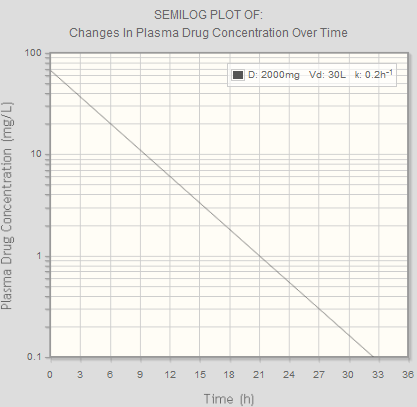
A graph of log concentration against time (see below left) is very useful. However, to plot the graph, you need to calculate log10 of the concentration for every point.A quicker way to plot the results to obtain a linear graph is to plot a semilogarithmic graph in which the x-axis (time) uses a linear scale and the y-axis (concentration) uses a logarithmic scale. When you plot concentration against time, you obtain an equivalent linear graph (see below right).