Introduction To Agonists: Theory
Introduction To Dose-Response Curves
Up to now you have looked at how - in theory - occupancy varies with agonist concentration.
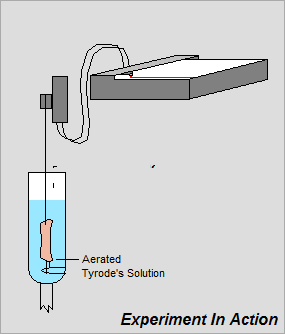
However, it is very difficult experimentally to measure how occupancy varies with agonist concentration and it is more usual to measure how a biological RESPONSE - such as
muscle contraction - varies with the agonist concentration.
The results of such experiments are plotted on:
However, it is very difficult experimentally to measure how occupancy varies with agonist concentration and it is more usual to measure how a biological RESPONSE - such as
muscle contraction - varies with the agonist concentration.
The results of such experiments are plotted on:
Dose-Response Curves
(also known as Concentration-Effect Curves).
(also known as Concentration-Effect Curves).