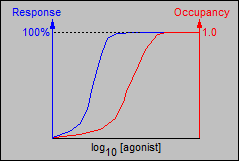
The graph below shows two sets of results for ONE agonist:
the blue graph shows the dose-response curve and the red curve shows the occupancy.
What do you notice about occupancy and size of response? Click on your choice.
the blue graph shows the dose-response curve and the red curve shows the occupancy.
What do you notice about occupancy and size of response? Click on your choice.