Introduction To Agonists: Theory
Dose-Response Curves
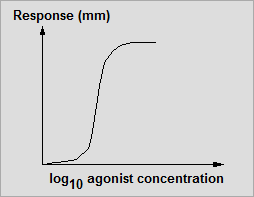
A dose-response curve shows response against log10 agonist concentration - see the graph below left.
Sometimes, rather than showing the actual response, the response is plotted as a percentage of the maximum response possible. The graphs are very similar but the second graph shows ratios - percentage values - rather than absolute values. This means that comparisons can be made between experiments.