Introduction To Agonists: Theory
Introduction To Occupancy Continued
A good way to show how occupancy varies with agonist concentration is to plot a graph.
Question about the resulting graph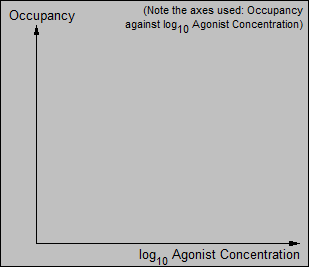
To see what happens as the agonist concentration increases, click here and look at the graph below.
Question about the resulting graph