Introduction To:
The Method Of Residuals
You will now use the method of residuals to find the residuals graph.
If the residuals graph is linear, you will then go on to use the graph to find the absorption half-life and the absorption rate constant.
Overview of how to obtain the residuals graph
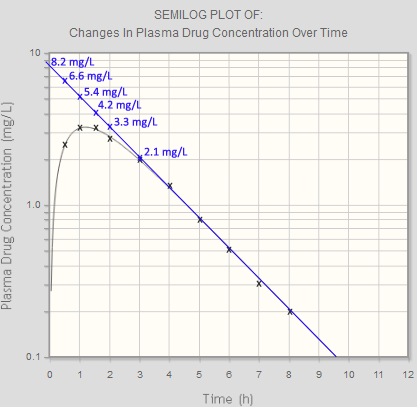
The main graph has been extrapolated back for you and the values of C* found. The values of C* are shown on the graph and in the table.
(C* is the concentration as read off from the blue, extrapolated graph. C is the concentration from the original concentration-time curve.)