Oral Dosing - Introduction
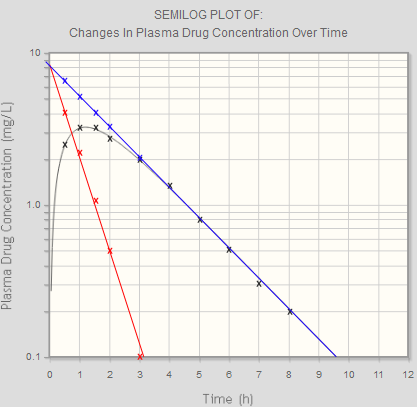
The remaining values of C*-C have been calculated for you. The values of C*-C have then been plotted on the same axes as the concentration-time curve and the best fit line drawn - this is the residuals graph, drawn in red.
Looking at the residuals graph, you can see that it forms a straight line. This tells you that absorption IS a first order process.
You can therefore use the residuals graph to find the absorption half-life, and from this, the absorption rate constant.
Turn to the next page to find the absorption half-life.